- Summertime is Summer Tire Check Time: 7 Tips To Combat 11,000+ Tire-Related Accidents Annually — and Keep Tires Rolling for Longer
- 10 DIY Tips to Add Years to a Vehicle’s Life & Minimize Expensive Repairs
- Defensive Driving Tips to Avoid Costly Repairs As Wintery Driving Conditions Continue to Plague Roads
- AutoPartsWarehouse.com 2013 Child Passenger Safety Tips and Resource Guide
- Top Five Parts to Make Your Vehicle More Fuel Efficient
All posts tagged "infographic"
-
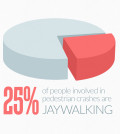 Florida is America’s Most Dangerous State for Pedestrians [Infographic]
According to NHTSA’s 2011 Traffic Safety Facts, which was published August 2013, Florida has the highest pedestrian fatality rate among all states, with 2.57 pedestrian fatalities per 100,000 persons.
- Posted September 12, 2013
-
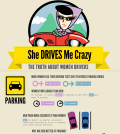 She DRIVES Me Crazy: The Truth About Women Drivers [Infographic]
When you see a reckless driver or when pass by an accident on the road, have you ever heard someone say “it must be a woman”? In the battle of the sexes, women are usually stereotyped as...
- Posted September 4, 2013
-
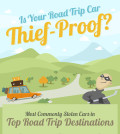 Is Your Road Trip Car Thief-Proof? [Infographic]
If you’re planning to visit some of the most popular road trip destinations, take a look at the commonly stolen vehicles at five top locations, and learn what you can do to keep your car safe.
- Posted August 28, 2013
-
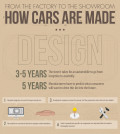 How Cars are Made [Infographic]
We all know cars are made in large, noisy factories but do you really know how a vehicle develops from a concept in a designer’s mind into a showroom centerpiece? Let our infographic show you how!
- Posted December 1, 2012
-
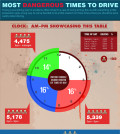 Most Dangerous Times to Drive [Infographic]
The sad reality is that thousands of people get injured or die in the country each year while they’re on the road. Although it’s true that cars today are safer than ever, we’re still far away from...
- Posted November 30, 2012

-
 Kendall Motor Oil Knowledge Session-Things to know about Full Synthetic Motor Oil Additives
By AutoPartsWarehouse Staff, images courtesy of Kendall Motor Oil...
- November 10, 2017
-
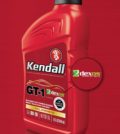 Kendall Motor Oil Knowledge Session-Things to know about Full Synthetic Motor Oil
By AutoPartsWarehouse Staff, images courtesy of Kendall Motor Oil...
- November 10, 2017
-
 Autolite Iridium XP Spark Plug Install
by Steve and Gavin Maloof The guys at AutoPartsWarehouse...
- August 2, 2017
-
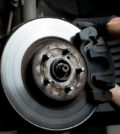 Car Care 101: Common Reasons Why Your Brakes Squeak
Does it bother you when you hear unusual noises...
- June 28, 2017
-
 Car Care Checklist for Summer: Part II
Here are more things to consider to get your...
- June 24, 2017
-
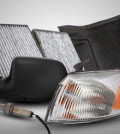 Top Five Auto Parts the Average Consumer Should Purchase Online — and Here’s Why!
AutoPartsWarehouse.com says the Internet is the best place for...
- January 21, 2013
-
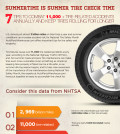 Summertime is Summer Tire Check Time: 7 Tips To Combat 11,000+ Tire-Related Accidents Annually — and Keep Tires Rolling for Longer
U.S. drivers put almost 3 billion miles on their...
- June 4, 2014
-
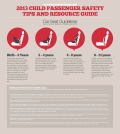 AutoPartsWarehouse.com 2013 Child Passenger Safety Tips and Resource Guide
A Wake Up Call On Child Passenger Safety The...
- September 12, 2013
-
 6 Amazing Classic Car Restorations
Restoring old cars always come with a hefty price...
- November 24, 2014
-